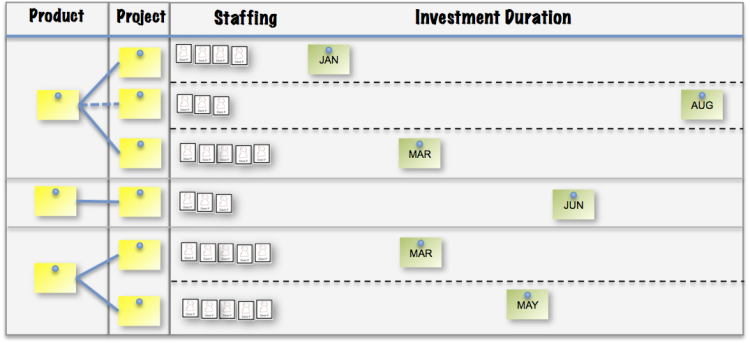
I’ve found the following visualisation really useful for weaning organisations off using the project approach for software development. This visualisation unpicks two major contentions common in orgs:
Staff contention – the over-allocation of staff (not resources!!), this is where one person is allocated to multiple projects, .33 FTE on Project 1, .25 FTE on Project 2, etc. Someone somewhere has a ‘clever’ spreadsheet which shows an individuals ‘capacity’ adding up to 1 FTE. Anything less than 1 FTE is often called spare capacity and anything over 1 FTE is referred to hero’s who go the extra mile. Ultimately though any individual who is time slicing between projects is wasting most of their time.
Code base contention – having multiple project teams trying to work on the same codebase (each with their own goals and deadlines) is obviously bad but this is extremely common. There are times though when two projects can work on completely separate areas of the codebase without tripping over each other.

In the diagram above:
- Products have multiple projects
- Solid blue lines represent contention developers tripping over each other or release complexity.
- Dotted blue lines are for projects that don’t create contention
- The staffing column shows who is working on each project.
- The golden rule for staffing is that you cannot have multiple avatars for an individual.
- Staff can only be allocated to one project at a time.
- The Investment Duration part does not represent project delivery milestones or deadlines. They simply show when the current investment for a particular project comes to an end.
Using this approach enables “decision makers” to see clearly the impact of their aspirations – but most importantly, drives the right kind of conversations. The question of “why do we organise work in this way?” often crops up…

